


What's New
Upgrade to iOS 15.0
App Description
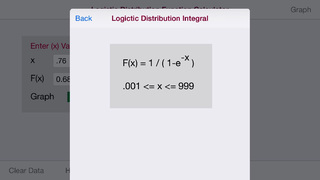
The Logistic Distribution is a continuous single-parameter distribution which has been used extensively to represent growth functions. The Logistic Distribution curve has a shape similar to the Normal Distribution.
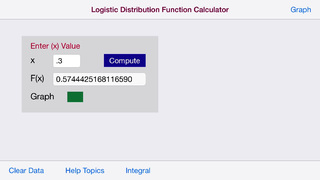
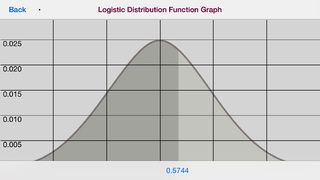
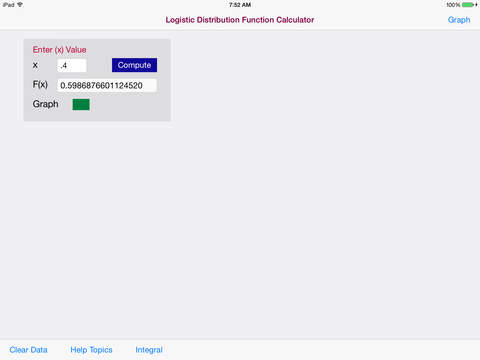
The Logistic Disribution Calculator accepts a random variable x and returns the probability that the random variable with a standard Logistic Distribution has a value less than variable x. The Logistic Distribution F(x) graph displays the Logistic Distribution as a bell-shaped curve for a given value of the random variable x.
The Data Tables and Graphs increment the x value 200 times with a 0.01 increment value with -1.0 greater x less 1.0.
The graphs are touch enabled. Upon touching the graph a vertical line appears. Move the vertical line to the left or right to display the point (x/f(x)) data in the upper left of the graph.
The horizontal x-axis displays x values. The vertical y-axis plots a range of F(x) values.
Horizontal Max and Min dashed line display the Maximum and Minimum F(x) values
iPhone Screenshots
(click to enlarge)


iPad Screenshots
(click to enlarge)


App Changes
- October 02, 2014 Initial release
- March 12, 2015 New version 1.1
- May 07, 2015 New version 1.2
- January 30, 2016 New version 1.3
- November 08, 2016 New version 1.4
- June 14, 2019 New version 1.5
- January 06, 2020 New version 1.6
- October 22, 2020 New version 1.7
- October 08, 2021 New version 1.8
Other Apps From Donald Schaefer