


What's New
Upgrade to iOS 14, watchOS7
App Description
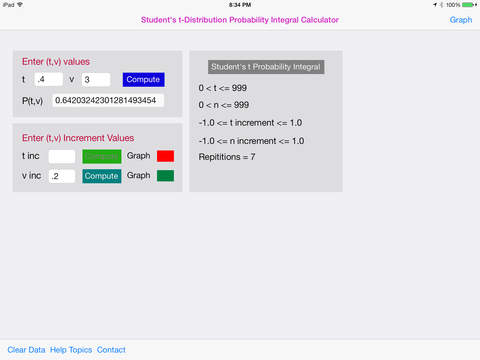
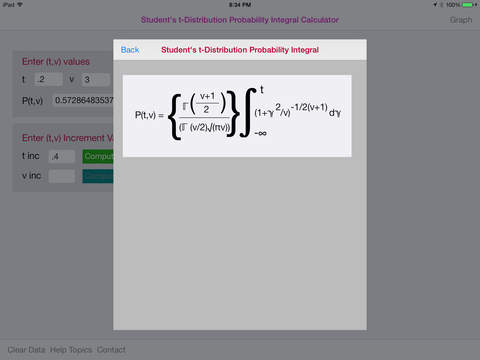
In probability and statistics, Student's t-distribution (or simply the t-distribution) is any member of a family of continuous probability distributions that arises when estimating the mean of a normally distributed population in situations where the sample size is small and population standard deviation is unknown.
The Student’s t-distribution app has three data input parameters - the Number of Degrees of Freedom (range 2-20), a Step Size parameter for evaluation points for the PDF and CDF Distributions and the Percentile parameter.
The Student’s t Distribution app also displays a touch enabled graph for the x/f(x) generated values. The graph is touch enabled graph. Upon touching the graph a vertical line appears. Move the vertical line to the left or right to display the point x/f(x).
The horizontal x-axis displays x values. The vertical y-axis plots a range of either the x-increment and y-increment values
Horizontal Max and Min dashed lines display the Maximum and Minimum values.Automatic incrementing of the value.
iPhone Screenshots
(click to enlarge)


iPad Screenshots
(click to enlarge)


Apple Watch Screenshots
(click to enlarge)


App Changes
- August 31, 2014 Initial release
- March 12, 2015 New version 1.1
- April 27, 2015 New version 1.2
- February 03, 2016 New version 1.3
- November 06, 2016 New version 1.4
- November 15, 2016 New version 1.5
- June 15, 2019 New version 1.6
- January 14, 2020 New version 1.7
- October 22, 2020 New version 1.8
Other Apps From Donald Schaefer