Our Network
Anyone who loves data visualization will absolutely love StockTouch. Users don’t even have to be that interested in the stock market to appreciate the brilliant design and execution of this app. However, the lack of real time data could potentially be a deal breaker for a real stockbroker who wants to use this as their only source of information on the job.
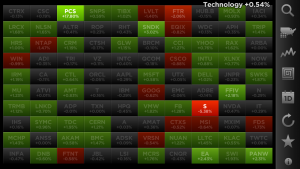
StockTouch visualizes stock data for the 100 largest stocks in 9 sectors of the economy. The stocks can either be US-based or global. The stocks are presented as a grid of color coded rectangles. The time period can also be changed from the default of 1 day to 1 week, 1 month, 3 months, 6 months, 1 year, or even as far back as 5 years.
The main screen is divided into 9 big categories: consumer, services, healthcare, energy, technology, financial, industrial, materials, and utilities. Each group has the percentage up or down that the group was for the day. The groups can be arranged by market cap or alphabetical order.
Tapping these expands each broad category. Then users see a grid of rectangles with companies’ stock symbols on them. Each rectangle is color-coded depending on how the stock did the set time period. So for instance, on the day I viewed Dell, it was green, indicating that it had a 1.02% increase in its stock price that day.
Tapping an individual rectangle brings up a company’s profile, with lots of information. Each profile has 3 pages and the first has lots of numbers, like the previous closing amount, and the price range that the stock saw today. A great feature on the first page of each profile is that relevant news stories for that company are displayed, which can really answer some questions about the performance of the stock. Tapping on a news story brings up that story within the app, which is a great feature so the app doesn’t have to be relaunched.
The second page of the profile is just a graph and the third page is full of even more news stories about the company. Although the initial graph is the price change for a stock, that can be changed to show other statistics, like the volume of relative trading activity.
The only big downside is that the app doesn’t have real time information. The data updates every 5 minutes, which could be a problem for a professional stockbroker with no other real time data. That said, anyone who casually checks the stock market once a day will have no problem with that.
StockTouch is a great app. I love how it takes what can be a very boring and mundane data set and makes it look appealing. It offers so much information and many different options. The only thing holding it back from being the perfect tool for a day trader is that the data is not updated in real time.
 PocketGamer.fun
  U.GG
U.GG  Icy Veins
  Arcade Cloud
  EV.IO
EV.IO