

What's New
iPadOS 16 compatibility
App Description
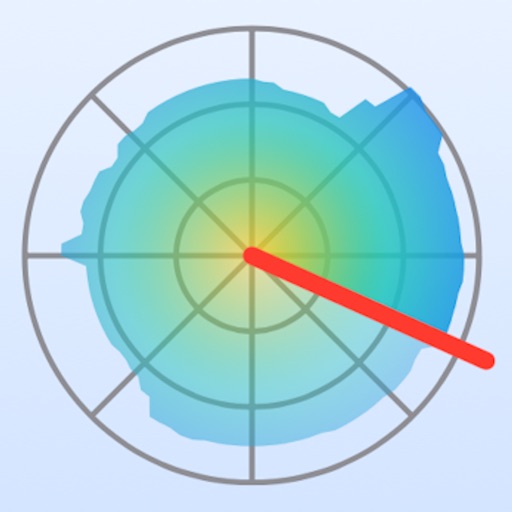
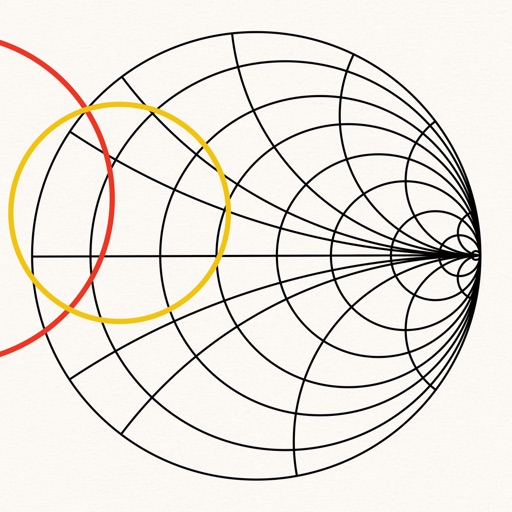
A great experience of the Smith chart. Also in dark mode.
With hand circles, ruler and point reader this chart can easily replace a physical one, making its use much faster.
Functionalities:
- Works on iPhone and iPad.
- Drag and zoom in the chart.
- Create multiple Smith Charts and name them.
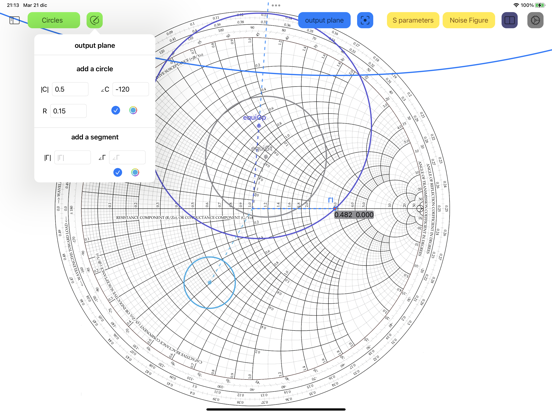
- Switch easily between input and output plane.
- Use a ruler and drag it with the finger or Apple Pencil to obtain the wavelength toward generator of a point on the chart, instantly.
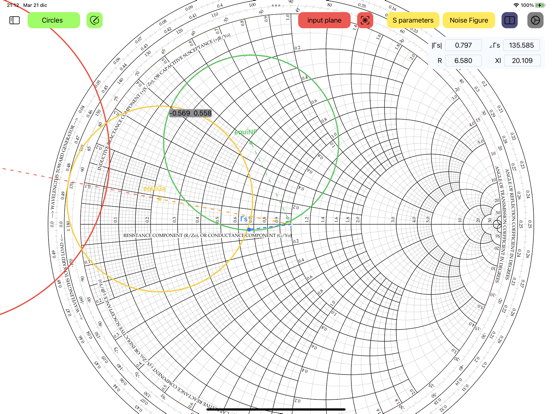
- Tap the chart with the finger or Apple Pencil to show the coordinates in algebraic notation, then tap on the pointer button to show magnitude and phase of that location, and the corresponding impedance.
- Insert circles by hand; modify the radius dragging a circle to keep the center in place, or press to translate them and modify the radius keeping the opposite side in place. Then use the padlock button to disable interaction of gestures with circles.
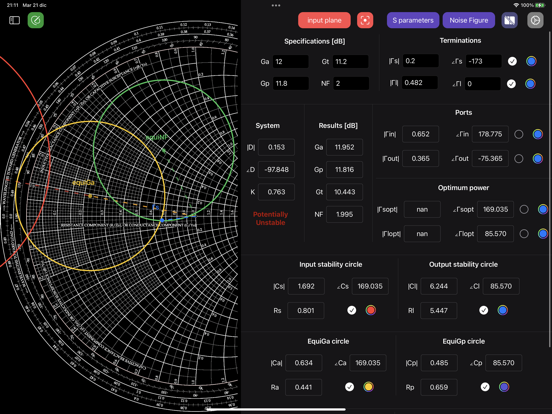
Advanced tools for engineering:
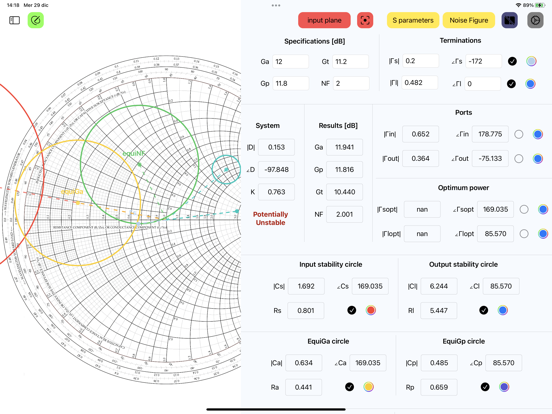
- Insert: scattering parameters, specifications (Ga, Gp, Gt, NF), noise data (gamma s optimum noise, minimum NF, rn) and the input/output reflection coefficients.
- You will see the results appear on the chart while you are inserting data.
- Results representable on the smith chart: input/output stability circles, equiGa, Gp, Gt, NF circles, reflection coefficients towards load and source and optimum power coefficients.
- Other results: obtained results (Ga, Gp, Gt, NF) and stability results (D, K, kind of stability).
- You can also insert a custom circle and a segment in the input and in the output plane, defining its center and radius in a textfield.
- Choose the color and if to show or not every result.
- Choose if to show or not the label of every result.
iPhone Screenshots
(click to enlarge)


iPad Screenshots
(click to enlarge)


App Changes
- December 31, 2021 Initial release
- September 15, 2023 New version 2.7.1
- September 15, 2023 Price increase: $0.99 -> $3.99
Other Apps From Edoardo Orzes