Reviewer's note: this review contains trader jargon that non-traders may not understand. This is a serious application that requires close scrutiny, as it is offering a number of patterns that could lead to risk reward in the market. If you're looking for a stock screener or a how-to-invest guide, this isn't it. It is built for the technical analysis trader.
I have been trading currencies on both technical and fundamental analysis for well over a year, which is in part why I chose to review Daily Stocks. I believe that I am qualified to look at Daily Stocks from a rational, trader's perspective rather than that of simply an iPad user who had this application in their review queue. The hype around Daily Stocks was strong and the price tag was significant, so my expectations were duly high.
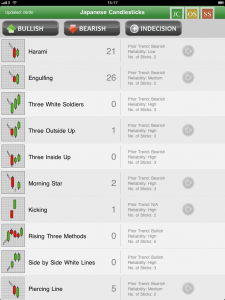 Upon opening Daily Stocks, you are presented with three simplistic screens. The first, entitled "JC" (Japanese Candlesticks) offers a number of bullish and bearish signals that the market experiences. Ten bullish signals are provided, most of which are established, but there are a few less popular signals that are a welcome addition. Equally, ten bearish signals are presented to the user, and three indecision signals make up the final part of this section. All signals offer three notes - the prior trend that the stock should have experienced, the reliability and the number of candlesticks in question. For example, the standard Three White Soldiers trend is an entry sign if there has been a bearish trend. It being a popular signal, its reliability is marked as "high". Finally, as the name suggests, there are three candlesticks to the signal. I must question exactly where the "Reliability" level is gauged from, because such methodologies are always subject to trend, market volatility and speculation. No two trading days are ever the same, and users could easily fall into the trap of buying into a stock simply because its reliability level is high. There is no visible warning about the risks of trading when held in portrait view, and in landscape a warning can only be found when tapping on the information section of the Market Summary dashboard.
 Beside each signal also lies a number of stocks that fit its description. For example, the Morning Star methodology presently has two stocks following its order. A brief and relatively understandable definition is given of each signal when tapped on. Daily Stocks claim that "all US stocks" are checked, and in our searching we found various stocks from the NASDAQ, NYSE and AMEX. However, given the ever-changing nature of the content, it won't always be this way. The wide variety of stocks does mean that most signals will have at least one or two stocks that fit its description - meaning there's always a potential opportunity somewhere.
The second screen highlights overextended (overbought and oversold) stocks, through various stages of SMA (single moving average) - 9 day, 20, 50, 100, 150 and 200. It is surprising that EMA (exponential moving average, placing more weight to more recent patterns) cannot be selected here, only SMA. This is a surprising oversight given EMA's popularity over SMA for short term trading. No customization is possible: what you see is what you get. Only stocks from the S&P 500 are presented. We had everywhere from 1 to 10 depending on which methodology we chose. However, the fact that this section exists is a major step forward for quick stock searching, as it massively reduces the amount of time searching if you trade within the parameters of Daily Stocks' offering.
The third screen is entitled Stock Scans, and is by far the most impressive section of the application. It uses a number of technical analysis combinations to emphasize certain stocks. It is split into six main sections:
- Performance - eight options, such as "closed down ... at least 4%" and "going up fast ... up at least 15% in 10 [days] or 10% in the last 5 days and closed positive today." This is a very useful section of the application, as it allows you to see quickly the biggest winners and losers in the recent market.
- Overextended Stocks - eight options, such as "oversold ... RSI (14) <30" and "oversold and turning ... RSI (14) crossed above 30 [and] MACD signal line is closer to MACD." Again, our only gripe is the lack of customization. Over time, traders begin to use a certain set of criteria before placing a trade and Daily Stocks limit your overall options.
- Crossovers - sixteen options, such as "stochastic bearish crossover ... %K crossed below %D" and "SMA 50 crosses below SMA 200."
- Volume Events - eight options, such as "rising volume ... increased for three consecutive days" and "low volume ... at least 50% less than 3-month average."
- Gaps - six options, such as "gap up ... gapped up at least 1% [and] closed higher" and "gap down ... gapped down at least 2% [and] closed lower."
All stocks can be seen in chart form when tapped on. Which stock you tap on (from whichever methodology, be it a Three White Soldier candlestick or an oversold stock measured by RSI (14) <30) will determine what set of technical tools are visible. Smart thinking.
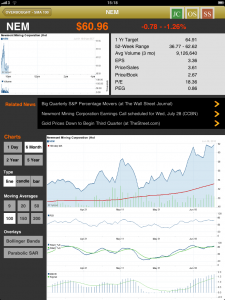
The charting screen itself is relatively simple. Up top you'll find the stock's ISO code, its price and percentage change on the day. Two charts are presented, one showing a constant 1 day chart and the other (larger, bottom right) is variable. Unfortunately, the variability options are somewhat limited. For an application that prides itself on candlestick patterns, tools that work within seconds, it was surprising to see that the shortest chart available was 1 day, rather than seconds or minutes. However, this limitation was to be expected as it pulls feeds off Yahoo! Finance, thus a fifteen minute delay exists. Although three other time periods are available (6 months, 2 years and 5 years) they appear obscure against the data that the application presents. For example, stocks with a 52 week high are shown in a category, but there is no 1 year chart.
Relievedly, you can choose between a line / candle / bar chart. Moving averages can be added on top of each other (9, 20, 50, 100, 150 and 200) to see crossover points, the lines being different colours for easier viewing. Additionally, Bollinger Bands and Parabolic SAR overlays can be added onto any stock provided.
Finally, related stock news and a quick financial summary are presented. The news links (three in total, no option to view more) lead to a plethora of sources, notably Yahoo! Finance, Reuters, MarketWatch (WSJ) and AP. When tapping on a link, it forwards you to the original source article - meaning you'll face the ads and non-related text that you would do on a desktop. This shouldn't be put against Daily Stocks entirely though, as it offers peace of mind that the article is correct and true. The financial summary (see pictures) offered is more detailed than Apple's Stocks application on the iPhone.
When you turn your iPad into landscape mode, a market summary column appears on the left, featuring: daily charts of the Dow Jones, NASDAQ and S&P 500; text based FTSE 100, DAX, CAC 40, Nikkei 225 and Hang Seng indexes, each with a percentage and actual change of the day. The column has both form and function, taking up just enough room and no more on the iPad's generous display. There is no way to make charts full screen (even of certain stocks), which I hope will be addressed in an update.
In short, Daily Stocks is sound. Its premise is good and its foundation solid, but at the minute users can't even search to see a specific stock, something that even free applications offer. Its lack of international markets data mean that non-US investors will find it somewhat redundant (the only section of international data we could find was in the Market Summary tab). And the lack of iPad integration (such as Apple's selection buttons and drop down menus rather than their own) make it feel unofficial and cheap, even though it never crashed during our test and is built solidly.
Ultimately, Daily Stocks exists not to please the eye but to please the portfolio. The signals are recognized internationally and the analysis used daily. There's nothing structurally wrong with the content provided, but it needs customization rather than a generic stream of data for it to be worth the money - at least to me. I just wish it felt more official, powerful and robust. Nonetheless, I haven't seen a stocks application as detailed as this one. The developers deserve credit for that. Ultimately, what trader you are and what tools you use will determine whether or not this application is worth it. I haven't seen a detailed technical analysis application that I could bring about with me wherever I go. Until now.
[gallery:thumbnail]
PocketGamer.com
AppSpy.com
148Apps.com
PocketGamer.fr
PocketGamer.biz
PCGamesInsider.biz
The Sims News
PocketGamer.fun
BlockchainGamer.biz
PG Connects
BigIndiePitch.com
MobileGamesAwards.com
 U.GG
U.GG
 Icy Veins
The Sims Resource
Fantasy Football Scout
GameKnot
Addicting Games
 Arcade Cloud
 EV.IO
EV.IO
 Luminosity