

What's New
• Support for iOS 13
• Various bug fixes and improvements
App Description
Graphical Analysis™ GW is a tool for science students to collect, graph, and analyze data from Vernier Go Wireless® sensors.
Sensor data-collection support:
• Vernier Go Wireless® Temp and Go Wireless pH sensors
• Vernier Go Wireless Heart Rate and Go Wireless Exercise Heart Rate monitors
• Vernier LabQuest® sensors used with Go Wireless Link or LabQuest Stream interfaces
• Basic support for some Vernier Go Direct® Sensors
• NODE (by Variable Inc.) sensor support
Additional experiment options:
• Data Sharing via Wi-Fi connection to LabQuest 2 or Logger Pro® 3
• Built-in Sensors (accelerometers)
• Manual Entry
Note: Sensor data collection and Data Sharing require the purchase of hardware from Vernier Software & Technology. Built-in sensor and manual entry of data can be performed without a hardware purchase. For more information on Data Sharing, visit http://www.vernier.com/css
Key Features - Data Collection
• Multi-sensor data-collection support
• Time Based, Event Based, and Drop Counting data-collection modes
• Configurable data-collection rate and duration for time-based data collection
• Sensor calibrations
• Option to zero and reverse sensor readings
• Graph match feature for use with motion detectors
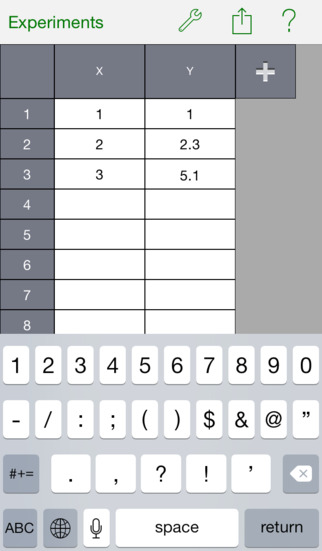
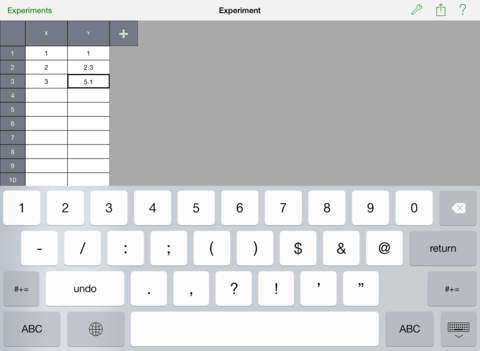
• Manual entry of data from keyboard and clipboard
Key Features - Data Analysis
• Display one, two, or three graphs simultaneously
• View data in a table or show a graph and table side-by-side
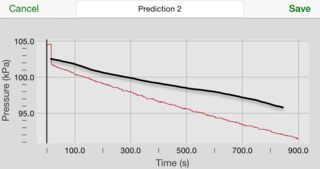
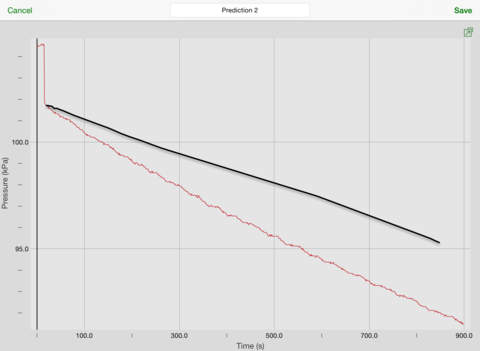
• Draw Predictions on a graph to uncover misconceptions
• Examine, interpolate/extrapolate, and select data
• Apply Statistics calculations to find mean, min, max, and standard deviation
• Perform curve fits, including linear, quadratic, natural exponent, and more
• Add calculated columns based on existing data to linearize data or investigate related concepts
• Pinch to scale graphs
Key Features - Collaboration and Sharing
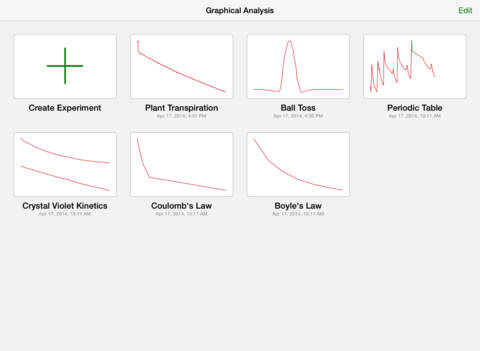
• Add graph titles
• Export graphs and data for printing and inclusion in lab reports
• Export data in .CSV format for analysis of data in spreadsheet software such as Excel®, Google Sheets™, and Numbers®
Vernier Software & Technology has over 35 years of experience in providing effective learning resources for understanding experimental data in science and math classrooms. Graphical Analysis GW is a part of the extensive system of sensors, interfaces, and data-collection software from Vernier for science and STEM education.
iPhone Screenshots
(click to enlarge)


iPad Screenshots
(click to enlarge)


App Changes
- June 14, 2014 Initial release
- August 02, 2014 New version 2.1.1
- November 03, 2014 Price decrease: $4.99 -> FREE!
- November 11, 2014 New version 2.1.2
- February 26, 2015 New version 2.2
- May 18, 2015 New version 2.3
- May 29, 2015 New version 2.3.1
- July 02, 2015 New version 2.3.2
- September 21, 2015 New version 2.4
- October 07, 2015 New version 2.4.1
- October 15, 2015 New version 2.4.2
- March 02, 2016 New version 2.5
- July 09, 2016 New version 3.0
- August 19, 2016 New version 3.0.1
- November 06, 2016 New version 3.1
- June 15, 2019 New version 4.0.5
- December 03, 2019 New version 4.0.6
Other Apps From Vernier Software & Technology